The network map of the stakeholders involved in the regeneration of Area 2 of Porto Marghera is shown in the figure below. The first noteworthy feature of the network is that almost all individuals are related to each other and thus form an interconnected component. There is one exception, as shown by the six actors who form a separate, star-shaped and isolated small component in the lower left part of the figure.
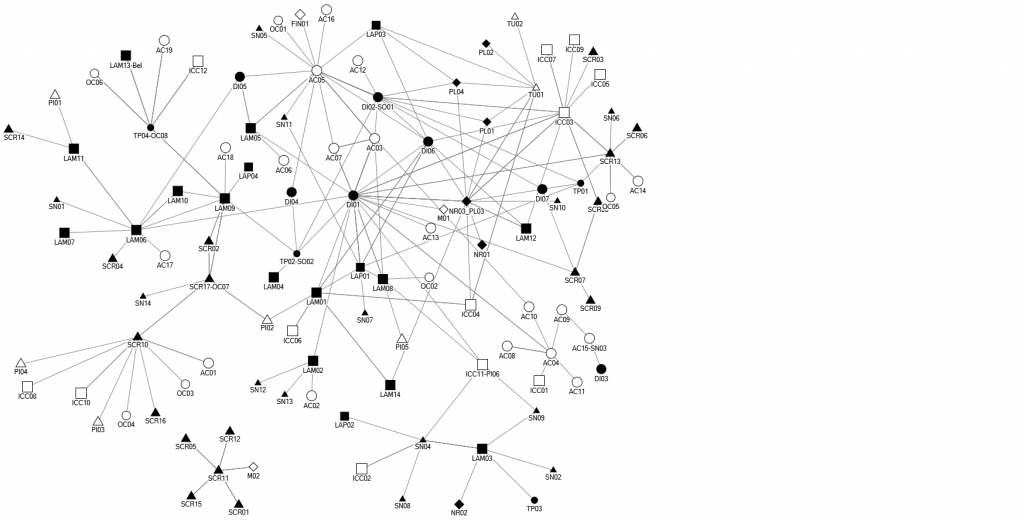
Figure caption: The network map of all stakeholder communicating on the regeneration of Area 2, Porto Marghera. The different shapes and identifiers correspond to different stakeholder categories and individuals.
Social network analysis allows the integration of different attributes, such as attitudes towards sustainability (i.e. endorsement of one of the three pillars of sustainability, social, economic and environmental) and their position within the social network.
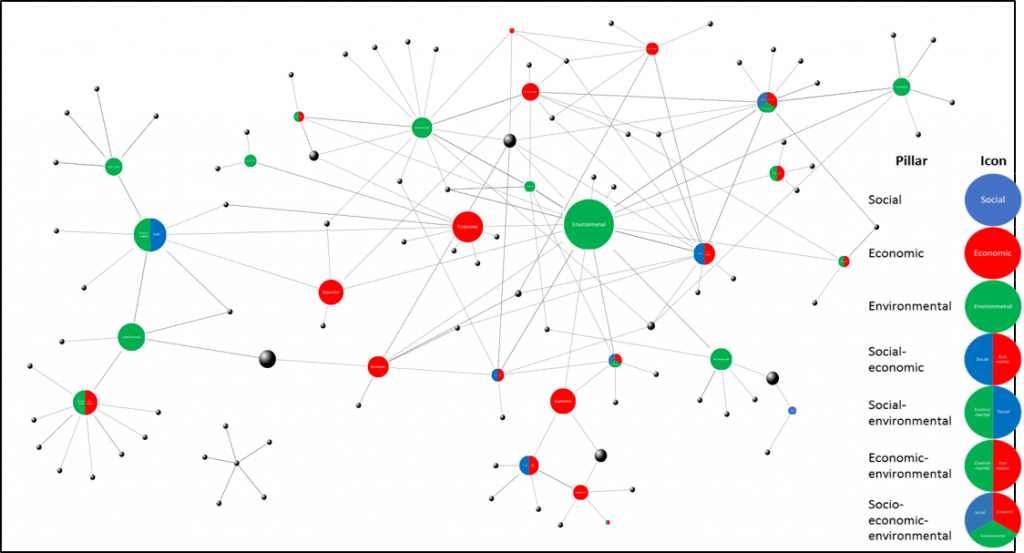
Figure caption: Social network map with attitudes towards the three pillars of sustainable development. The size of the circles is proportional to the degree of control over the flow of communication (betweenness centrality). The grey spheres are network members who have not participated in the survey.